On a travel map, a patch of green may be enough to say “woodland here”. On a map about forest management, it leaves an obvious question unanswered: what kind of woodland?
A naturally regenerating forest, a plantation and a tree crop can all look green on a satellite image. If the distinction matters to the project, it needs to survive in the map’s colours and legend.
The ForTy 2020 release announced in October 2026 gives us a useful example. The dataset distinguishes five forest and tree-use classes, plus other land. Its reference year is 2020: the release date does not make it a map of today’s forest conditions.
We rendered the main island of Madeira from the downloadable ForTy classification data. In the first panel, the five forest-related classes share one green. In the second, they keep separate colours. The underlying classifications and the geographic extent are identical.
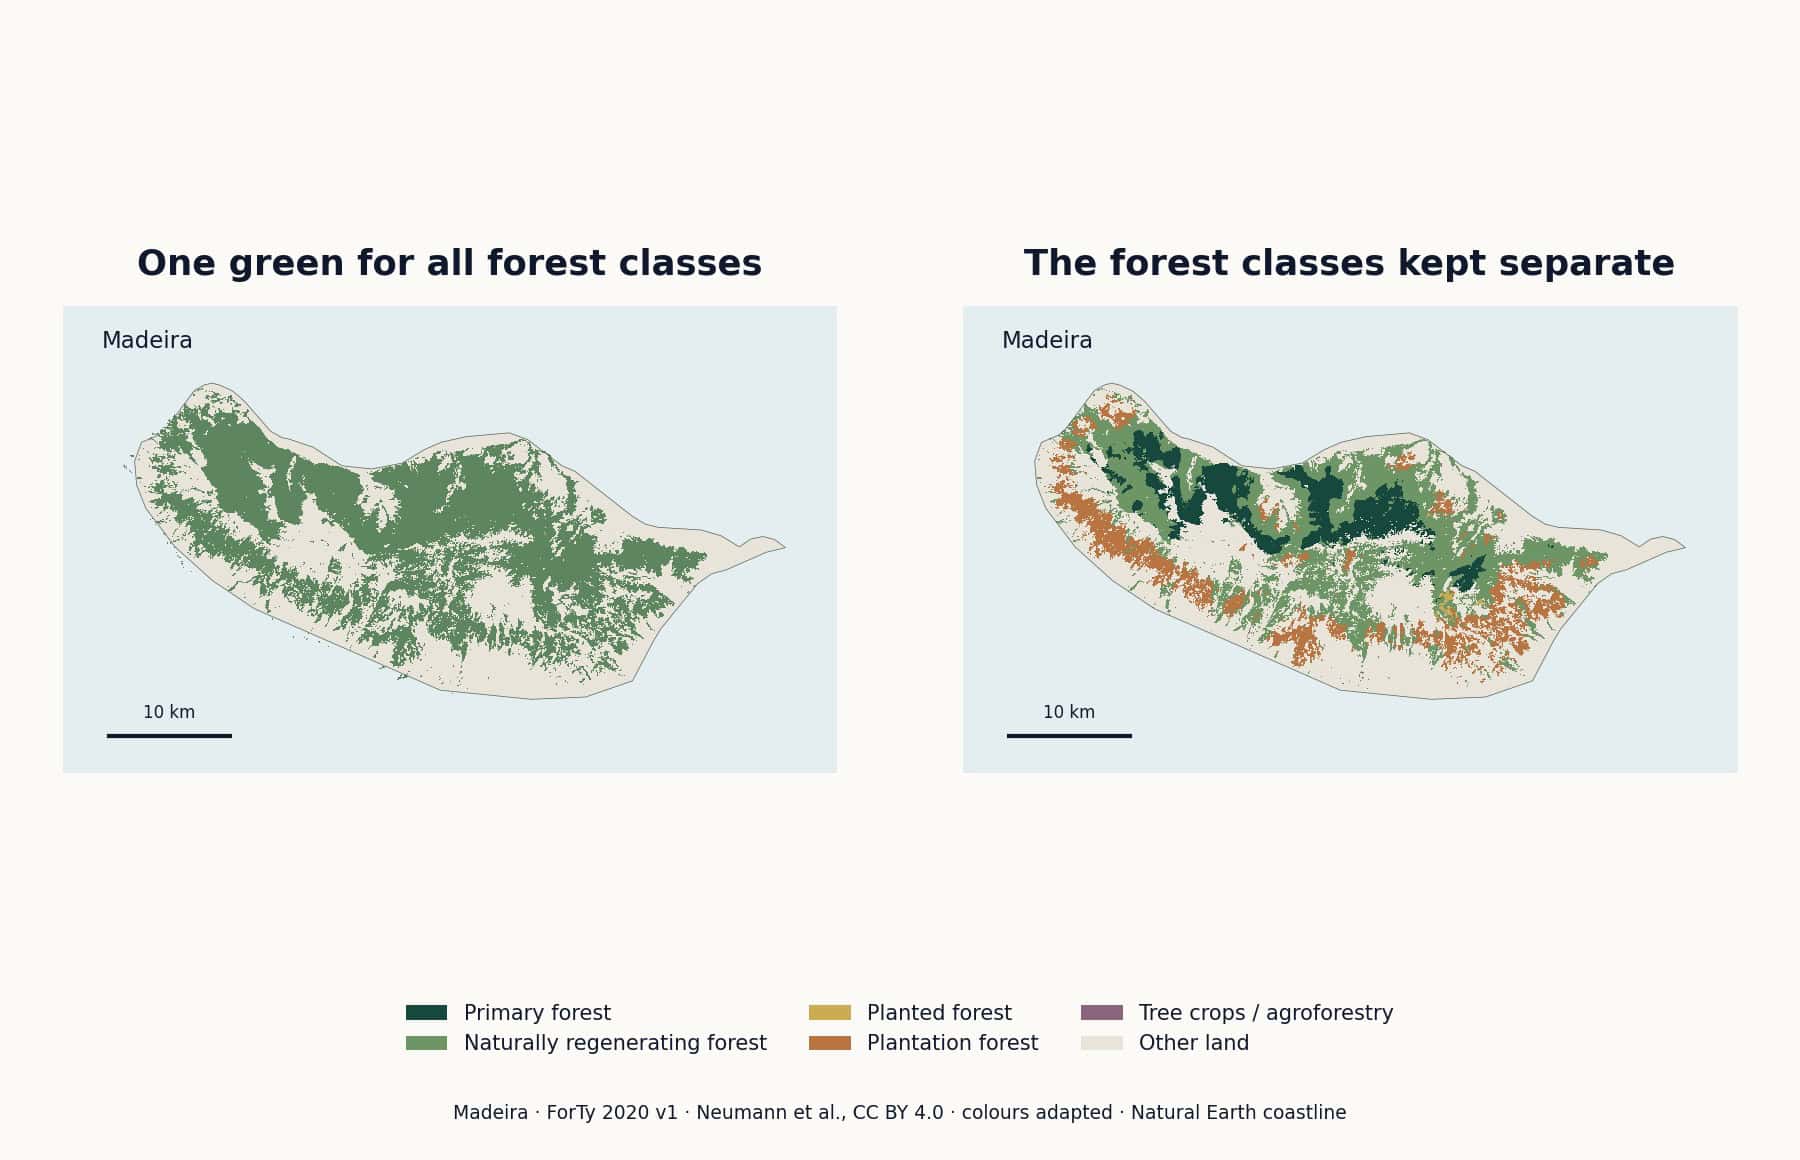
The single-green version answers a broad question: where does this dataset place its forest and tree-use classes? The coloured version lets you distinguish the assigned classes. It also makes clear why the definition matters: the grouped version includes tree crops and agroforestry, not just what every reader would casually call forest.
This is a rendering of the model’s 2020 classifications, not a new field survey of Madeira. The source raster is at 10-metre resolution; the illustration has been sampled for display. Small patches should not be interpreted as a current, property-level assessment.
ForTy separates primary forest, naturally regenerating forest, planted forest, plantation forest, tree crops and agroforestry, and other land. Those categories describe land and forest use. They do not simply form a scale from “less green” to “more green”. The dataset paper explains the definitions and classification method.
A map about management needs different distinctions from a map about tree species. Do not relabel these classes as broadleaf, conifer or mixed woodland. That would ask the dataset to answer a different question.
You can simplify the legend for a smaller publication, but say what you grouped. Combining categories for a display is an editorial decision. It does not change what the source originally measured or modelled.
Our example uses green, ochre, terracotta and plum tones for the forest-related classes, with a quiet neutral for other land. This is a palette made for the comparison, not an official ForTy colour standard.
A light-to-dark green ramp is tempting. It can also suggest that one category has more forest, more carbon or better condition than another. Unless your values support that reading, distinct hues with a clear legend are a safer starting point.
At the final size, check whether the smaller patches are still distinguishable. If they are not, reduce the number of displayed categories, enlarge the map or add a closer view. A tiny six-colour key cannot rescue a map that has become a green blur.
A forest map rarely needs every city and road from a reference map. In our Madeira comparison, a coastline, the island name and a scale bar supply enough orientation. More labels would mostly compete with the patches we want people to inspect.
If you build a layout using an editable base map, check which geographic layers it contains. Forest classifications are a separate dataset; they are not automatically included with an ordinary political map. Bring both sources into the same coordinate system before combining them in GIS, then prepare the final layout in your design software.
One green is a perfectly reasonable choice when the map only needs a broad background. Use more colours when the distinctions carry the story, and make the legend precise enough to explain them.
Maps, including the featured image: One Stop Map rendering of Forest Typology 2020 v1 classification data, Neumann et al., CC BY 4.0. Colours adapted and data sampled for display. Coastline: Natural Earth, public domain.