A flat blue ocean gives a map somewhere to rest. Add depth bands and the same space starts to tell a different story: shallow shelves around the continents, deep basins offshore, and long ridges through the middle of the ocean.
Bathymetry is the shape and depth of the seabed. On a general-purpose map, it can supply useful context without turning the artwork into a specialist chart. The main decision is whether that context helps your reader.
These two North Atlantic maps use the same land outline, extent and projection. On the left, the sea has one fill. On the right, lighter and darker bands represent increasing depth. The stepped colours come from real, generalised Natural Earth bathymetry polygons, derived from SRTM Plus.
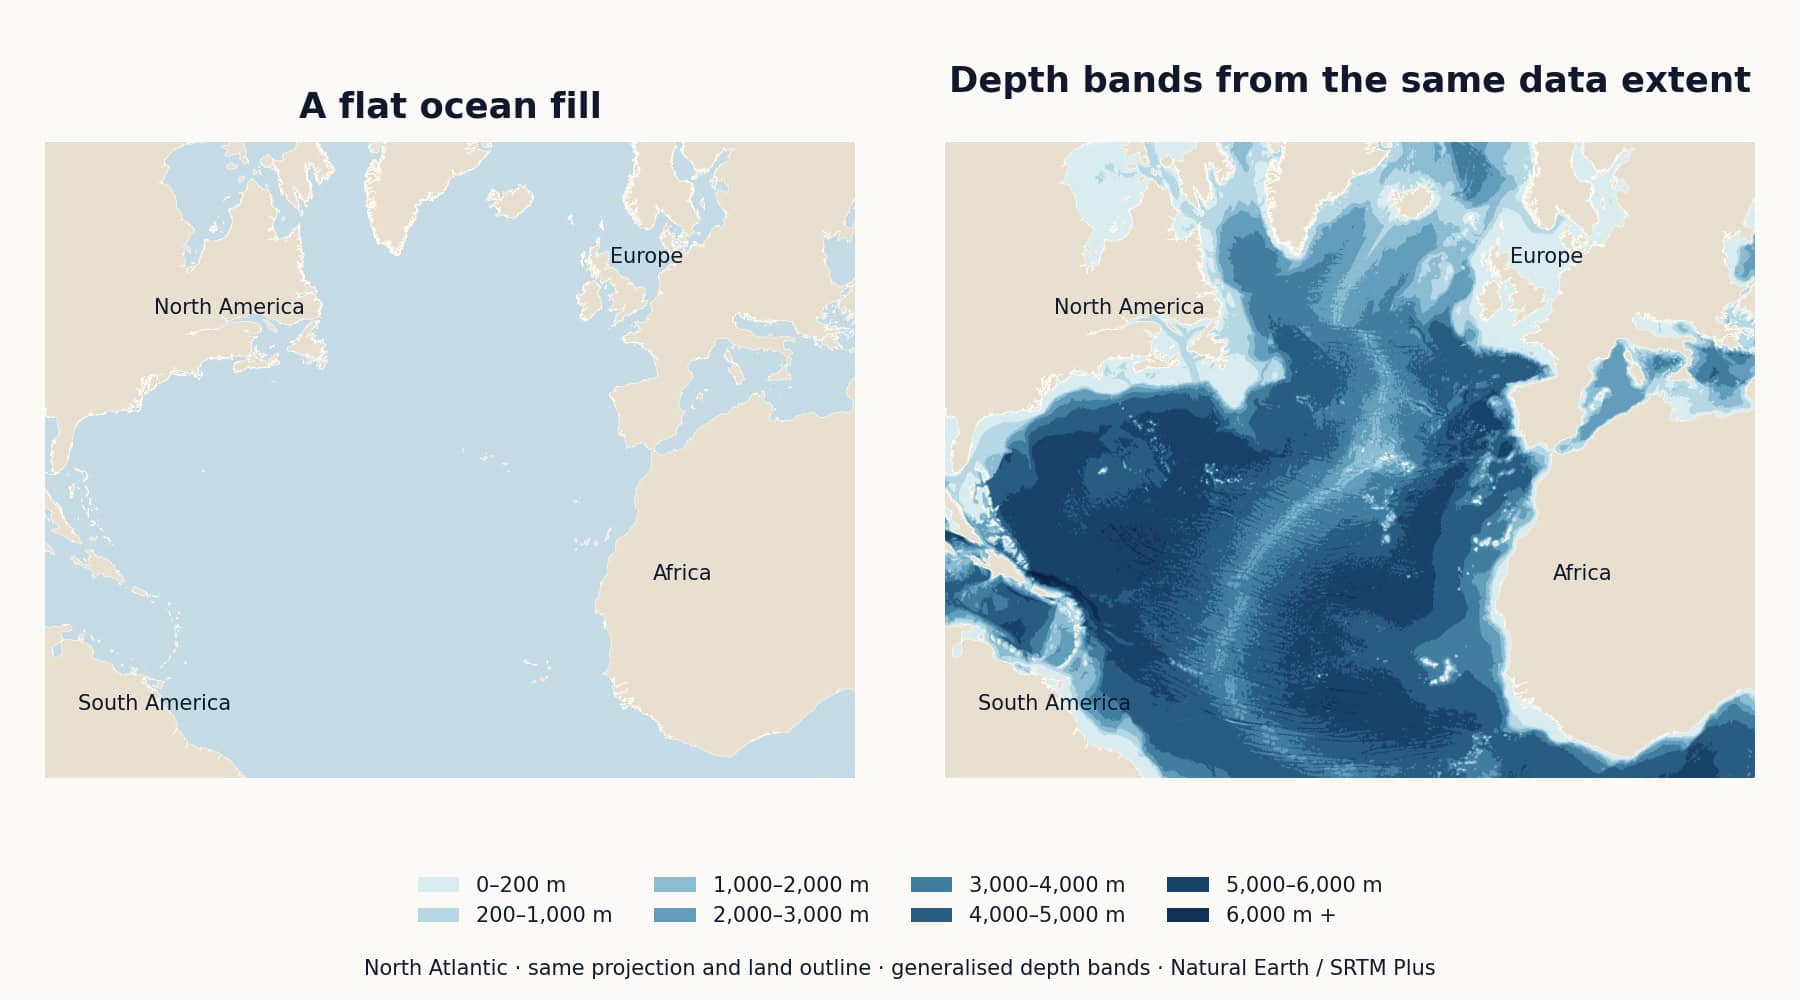
The plain version suits a simple locator or a map with a busy thematic overlay. The depth version gives more attention to the ocean itself. The light water around continental margins separates the shelves from deeper water, while the bands within the basin make its structure visible.
Neither treatment is inherently more finished. If your map explains where a company has offices, the ocean floor may add little. If it introduces an ocean, an island group or physical geography, a flat fill can leave out part of the subject.
Choose a palette that has an understandable direction. In our example, shallow water is pale and deeper water becomes darker. The legend supplies the depth ranges, in metres. Similar neighbouring bands keep the result calmer than a collection of unrelated colours.
Check the darkest names against the darkest water. A label that worked on a pale blue background may disappear over a deep basin. Sometimes a lighter label or a subtle halo is enough; sometimes it is better to move the name.
Land needs its own treatment too. Warm sand works here because it stays distinct from the blue sea. Keep that distinction when adjusting the palette for a brand or publication.
A filled depth band shows a range. A depth contour, or isobath, joins positions of equal depth. Shaded relief uses simulated lighting to suggest the shape of the terrain. They can be combined, but every extra treatment competes for attention.
For a small editorial map, a handful of bands may be enough. A larger educational layout may benefit from named features and a more detailed legend. Judge both at the size people will actually see.
Our Naturalist Mercator world map lists bathymetry and elevations among its vector layers. That is useful when you want to change the appearance of those areas in compatible vector software.
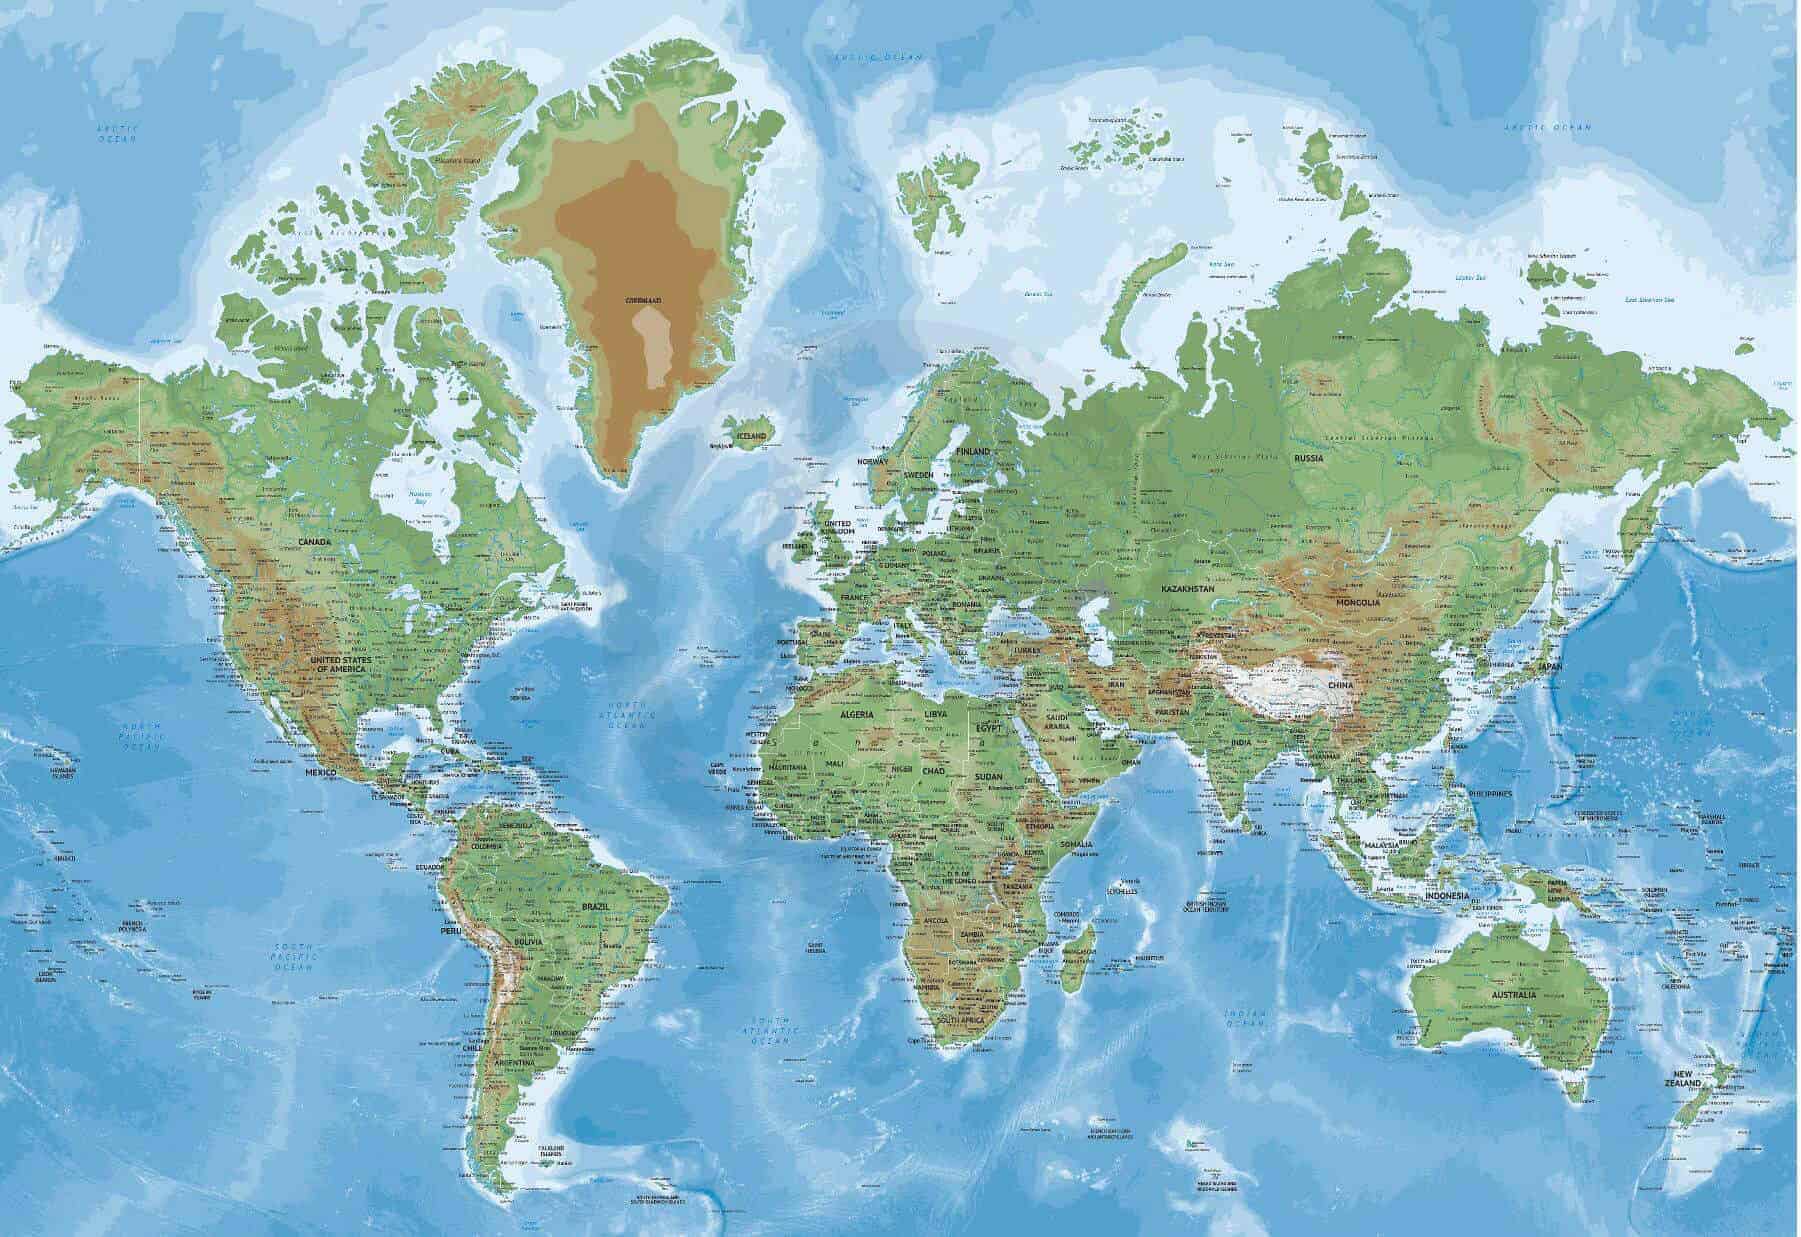
A relief image is a different kind of artwork. For example, the Pacific Ocean map in Summit style lists its shaded relief as an image layer. Its map features and labels are organised in vector layers, but the relief itself does not become editable vector contours. Read the layer list and choose the editable edition when you need that control.
It is easy to mistake a continuous coloured ocean for equally detailed knowledge everywhere. The IHO’s October 2026 announcement of the new GEBCO Secretariat says that more than 70% of the ocean remains unmapped to modern standards. That is about survey coverage, not a claim that those places have no estimated depths at all. Read the IHO announcement.
Our example uses generalised Natural Earth depth polygons, not a new GEBCO survey. They are suited to explaining the design choice at a broad scale. They should not be used for navigation or local depth decisions.
For your next map, start with the plain ocean. Add depth only when it explains something worth seeing, and give it enough room to be understood.
Comparison artwork: One Stop Map, using Natural Earth bathymetry and land outlines, public domain. Catalogue preview: One Stop Map.